
Portfolio Playground lets you build custom investment portfolios from real market data, visualize their historical performance, and compare key risk/return metrics side by side. Here’s what it can do.
Portfolio Builder. You search for any ticker symbol with autocomplete powered by yfinance, assign percentage weights, and create a named portfolio. Want to compare a tech-heavy portfolio against a diversified index fund? Build both and see the results immediately.
Preset Portfolios. For quick benchmarking, there are one-click presets: S&P 500 (VOO), NASDAQ 100 (QQQ), Developed Markets ex-US (VEA), Emerging Markets (VWO), Gold (GLD), Bitcoin (IBIT), and Volatility (VIXY). These make it easy to compare your custom portfolio against common benchmarks.
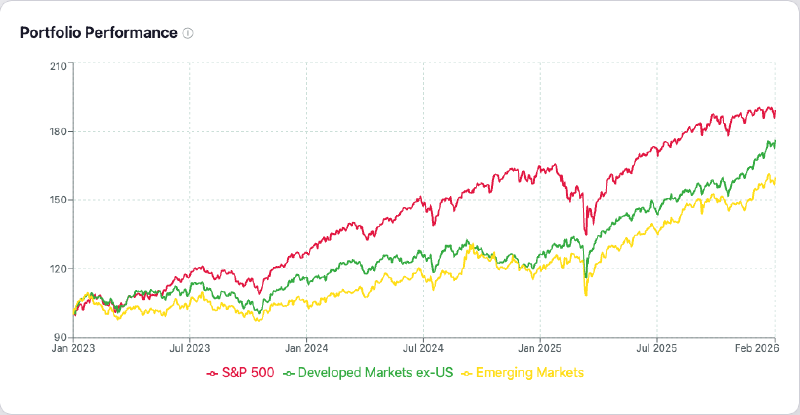
Performance Chart. All portfolios are plotted on a normalized $100-start line chart with a configurable date range. The normalization makes comparison fair regardless of actual share prices. Interactive tooltips and hover highlighting let you drill into specific dates and portfolios.
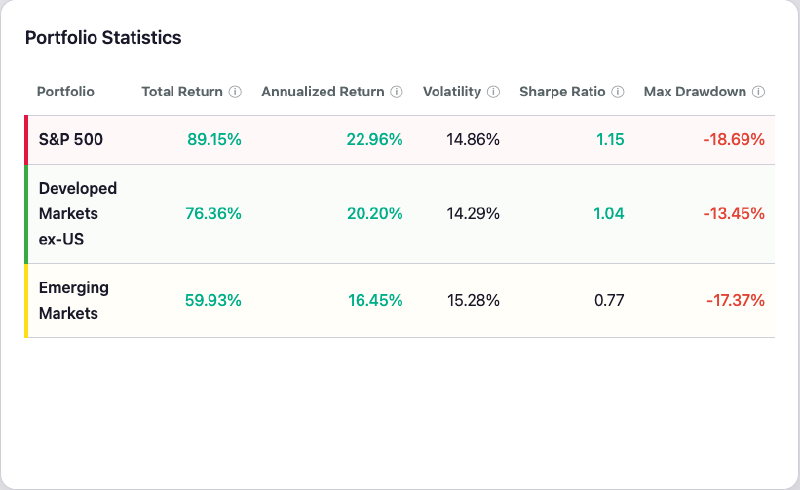
Statistics Table. A side-by-side comparison of Total Return, Annualized Return, Volatility, Sharpe Ratio, and Max Drawdown. Each metric has a tooltip explaining what it measures.
Multi-Currency Support. You can view all results in any of 40 currencies — from major ones like USD, EUR, GBP, JPY, and CHF to emerging-market currencies like BRL, CNY, INR, and KRW. The app fetches real exchange rates and applies the conversion, so you can see how your portfolio performs in the currency you actually spend.
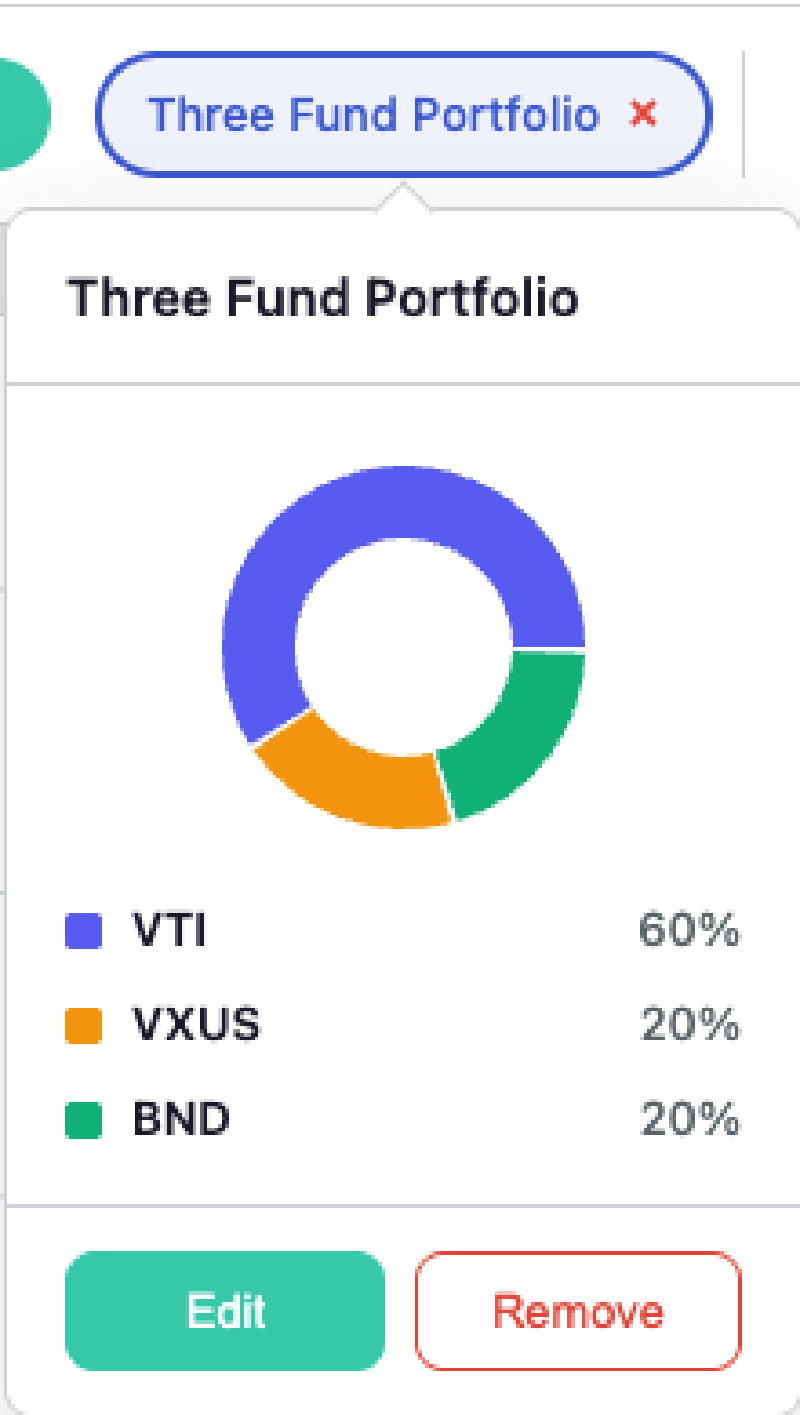
Asset Allocation View. Hover over any portfolio chip to see a donut chart breakdown of its holdings and weights. It’s a small detail, but it makes it much easier to remember what’s inside each portfolio when you’re comparing several at once.
Disclaimers#
This page and the accompanying webapp are for informational and educational purposes only. I am not a professional investor or financial advisor, nor do I claim to be, and use of this webapp does not create an advisory relationship. Data may be inaccurate, delayed, or incomplete, and I do not accept responsibility for any such inaccuracies. The content reflects my personal research and understanding and should not be interpreted as professional advice. You are solely responsible for your financial decisions — consult a qualified financial professional before making investment decisions.
The webapp is deployed using free tiers of Render and Vercel, so its availability is not guaranteed.